Gephi is an open-source social network visualization platform that can analyze and visualize big network graphs. Gephi utilizes a 3D render in order to show graphs in real-time and to make the exploration process more efficient. Gephi can be used by anyone to explore, analyze, filter, cluterize, change and send a lot of different kinds of network graphs.
In order to understand Gephi, it is important to understand networks first. A network is made of two parts: A list of the actors that make up the network, and a list of the relations (the interactions between actors). As part of a mathematical object, actors will then be called vertices (nodes, in Gephi), and relations will be referred to as tiles (edges, in Gephi).
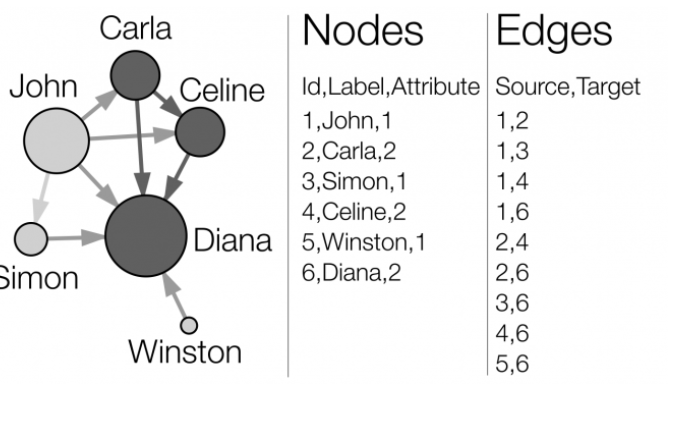
In the graph above, both actors and relations are very clear. Here you will see two attributes that are attached to the nodes: a label of people’s “name” and a numeric attribute (here, 1 for boys and 2 for girls). In the edge list, you see the identifiers (Id) that are composed with “Source” and “Target '' entries that refer to the nodes. Here, the attributes which are 1 (boy) or 2 (girl) determine the color of the notes. The size of a node depends on its number of connections (the value or degree centrality).
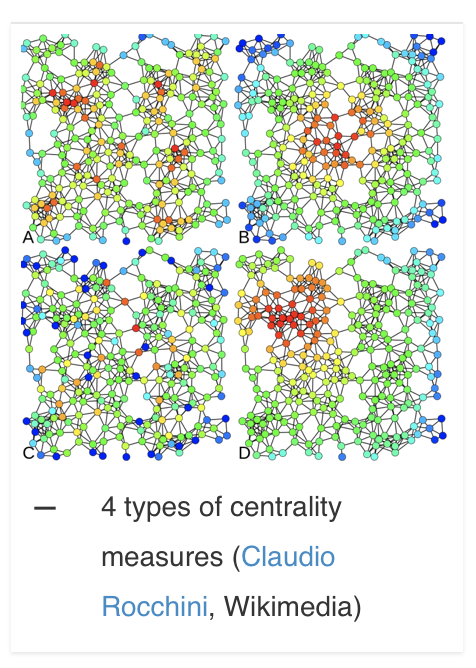
Here the graph above, it shows the centrality measures have four variations. The type A is degree centrality, or number of connections. Type B is closeness to the entire network. Type C is the between-ness, or bridges nodes.