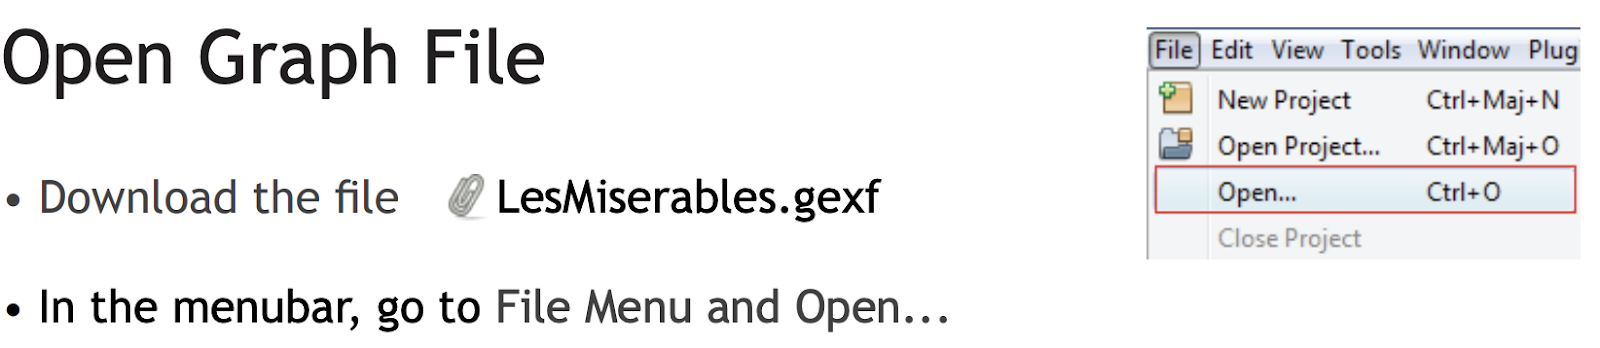
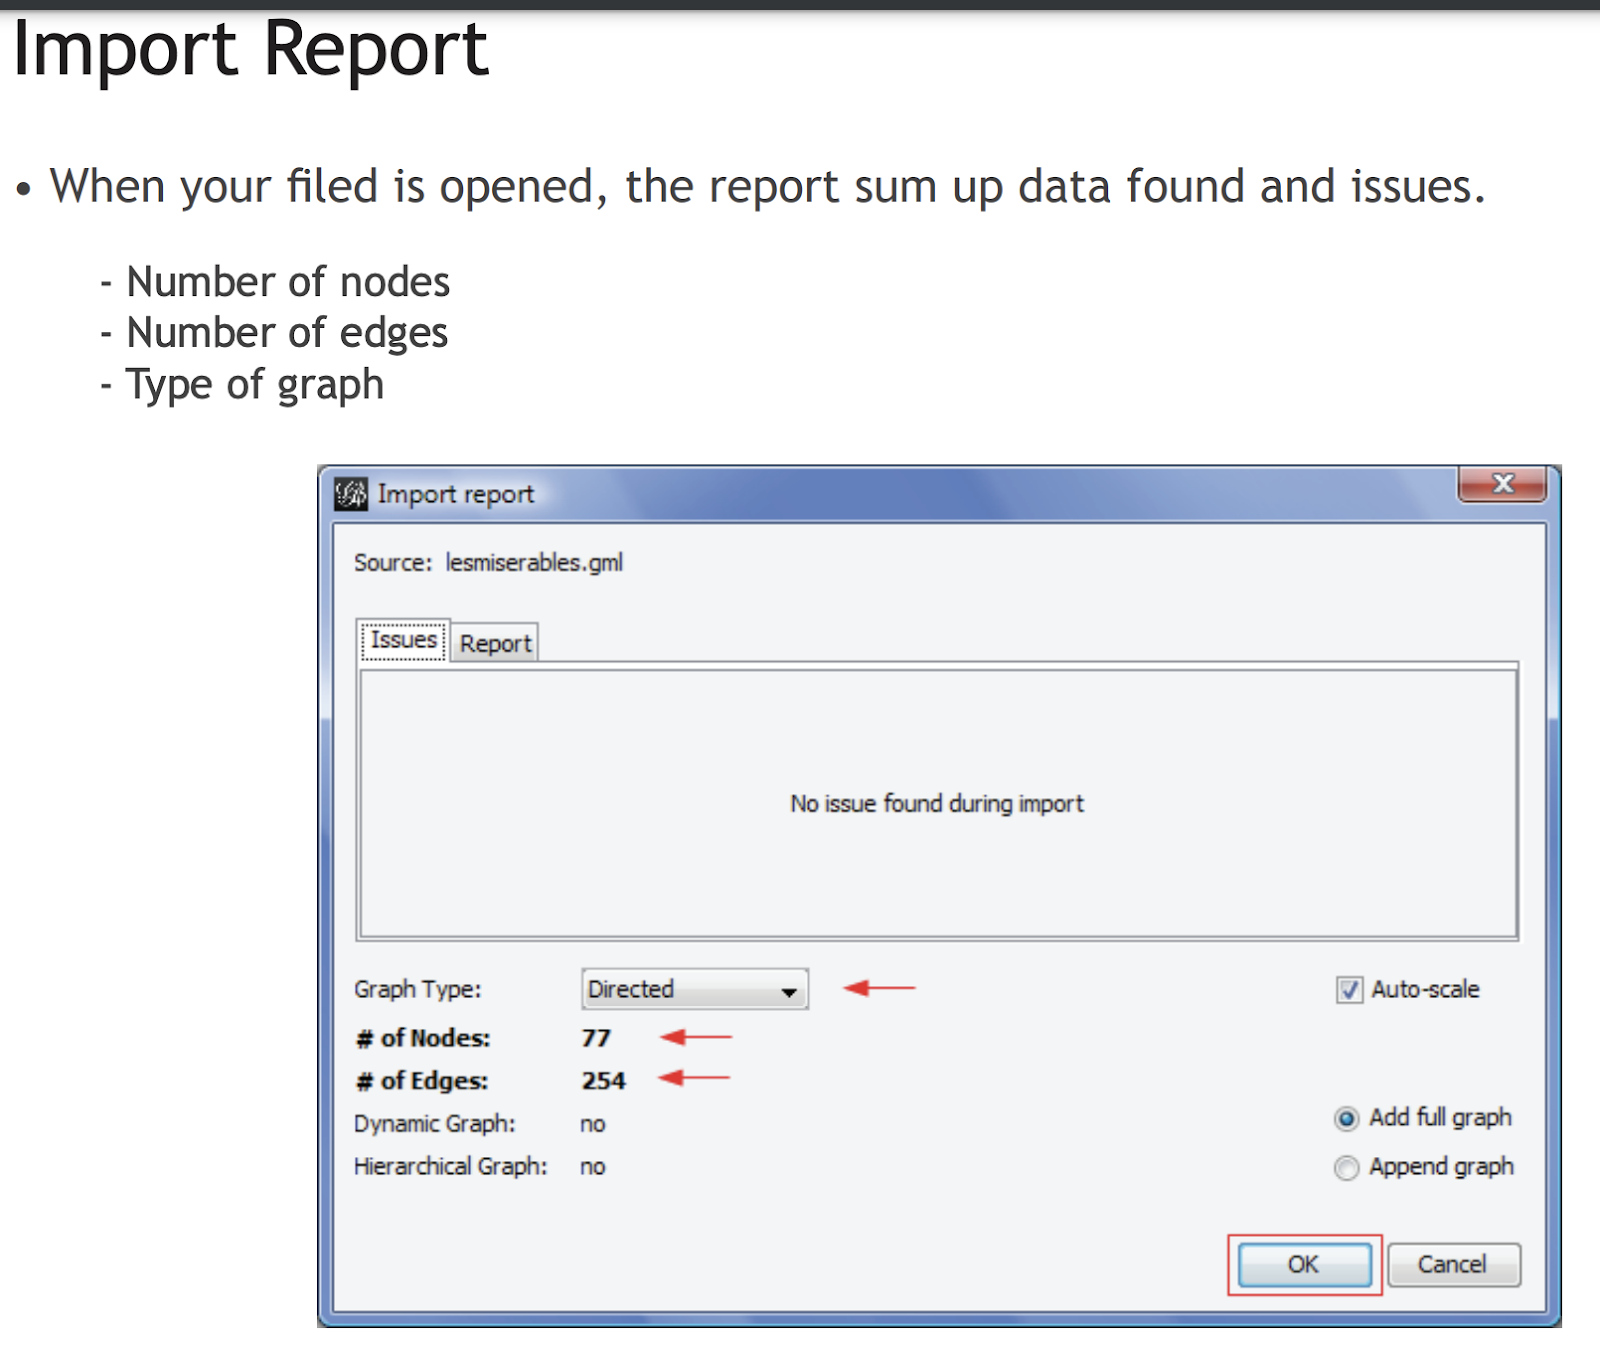
Step 1: Import Report that will give you a report of number of nodes, edges and type of graph
(Insert 1 chart)
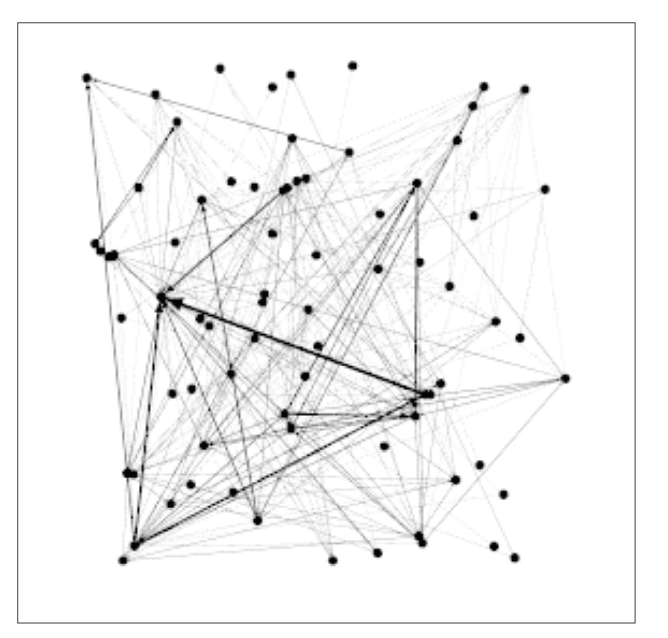
Step 2: Graph Visualization: Use your mouse to move and scale the visualization, and Locate the “Edge Thickness” slider on the bottom
(Insert 2 charts)
A graph should now show
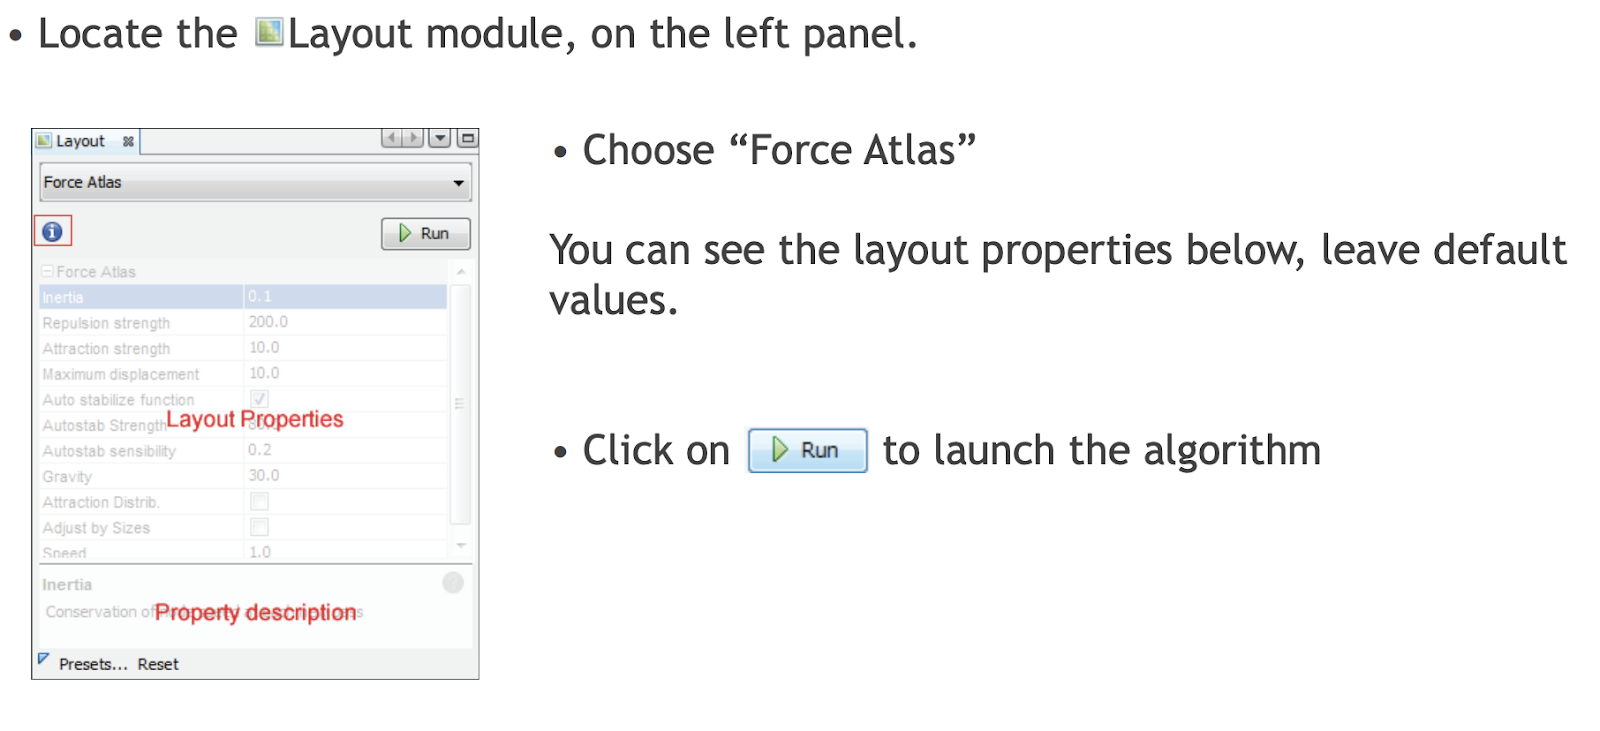
Step 3: Layout the graph: Set up the attributes of your graph & Control the layout
(Insert 1 chart)
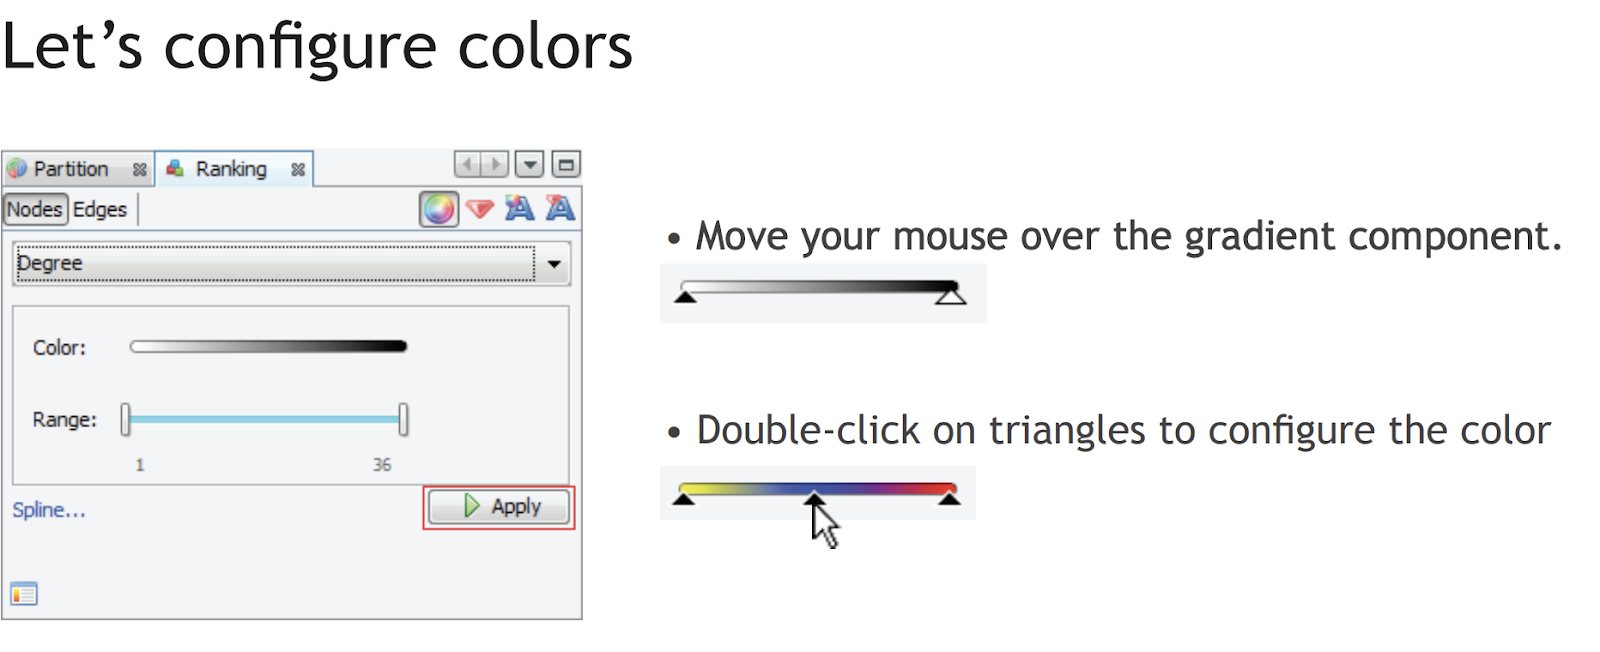
Step 4: Set up the color, and the result table
Insert 3 charts)
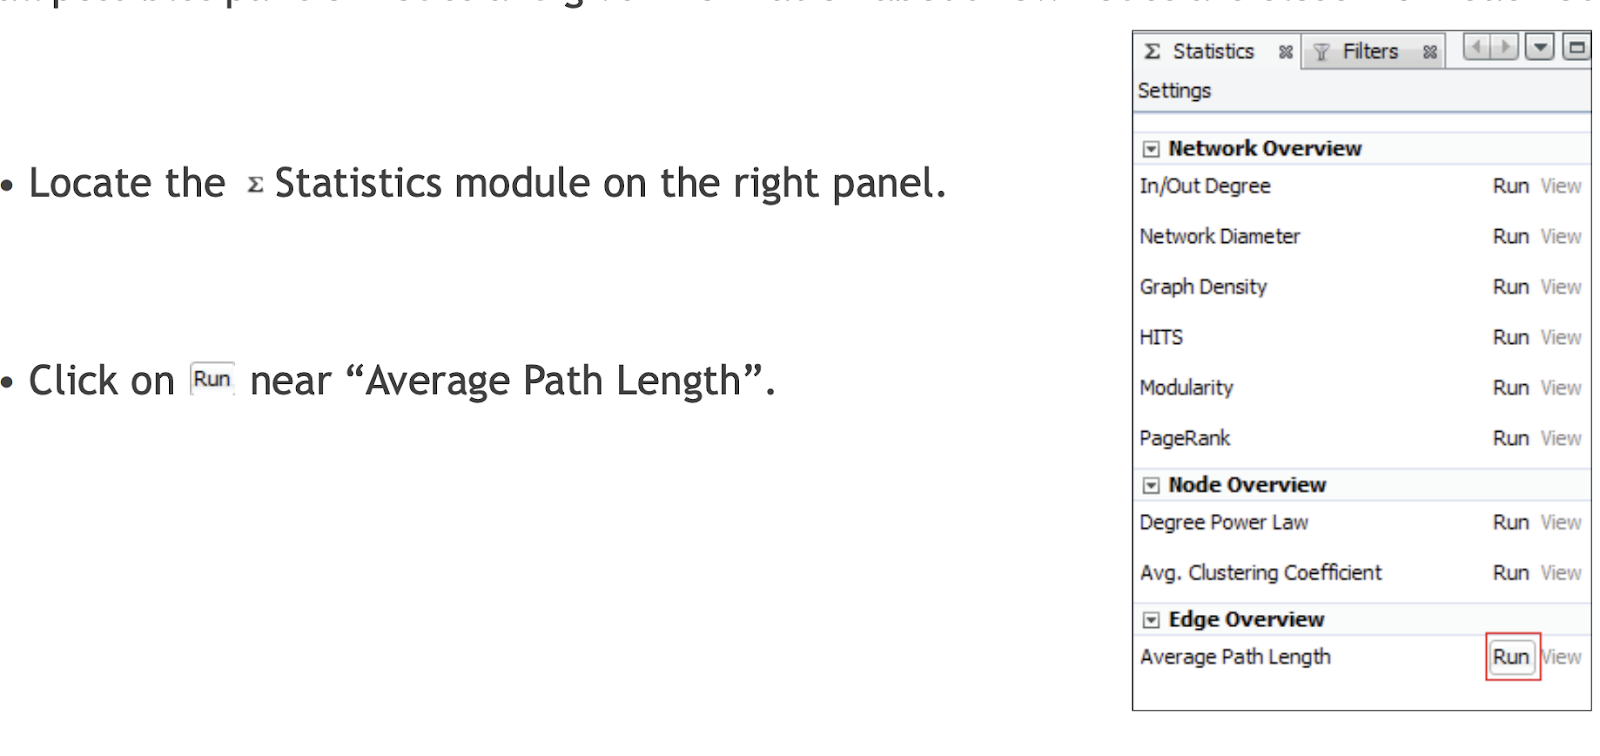
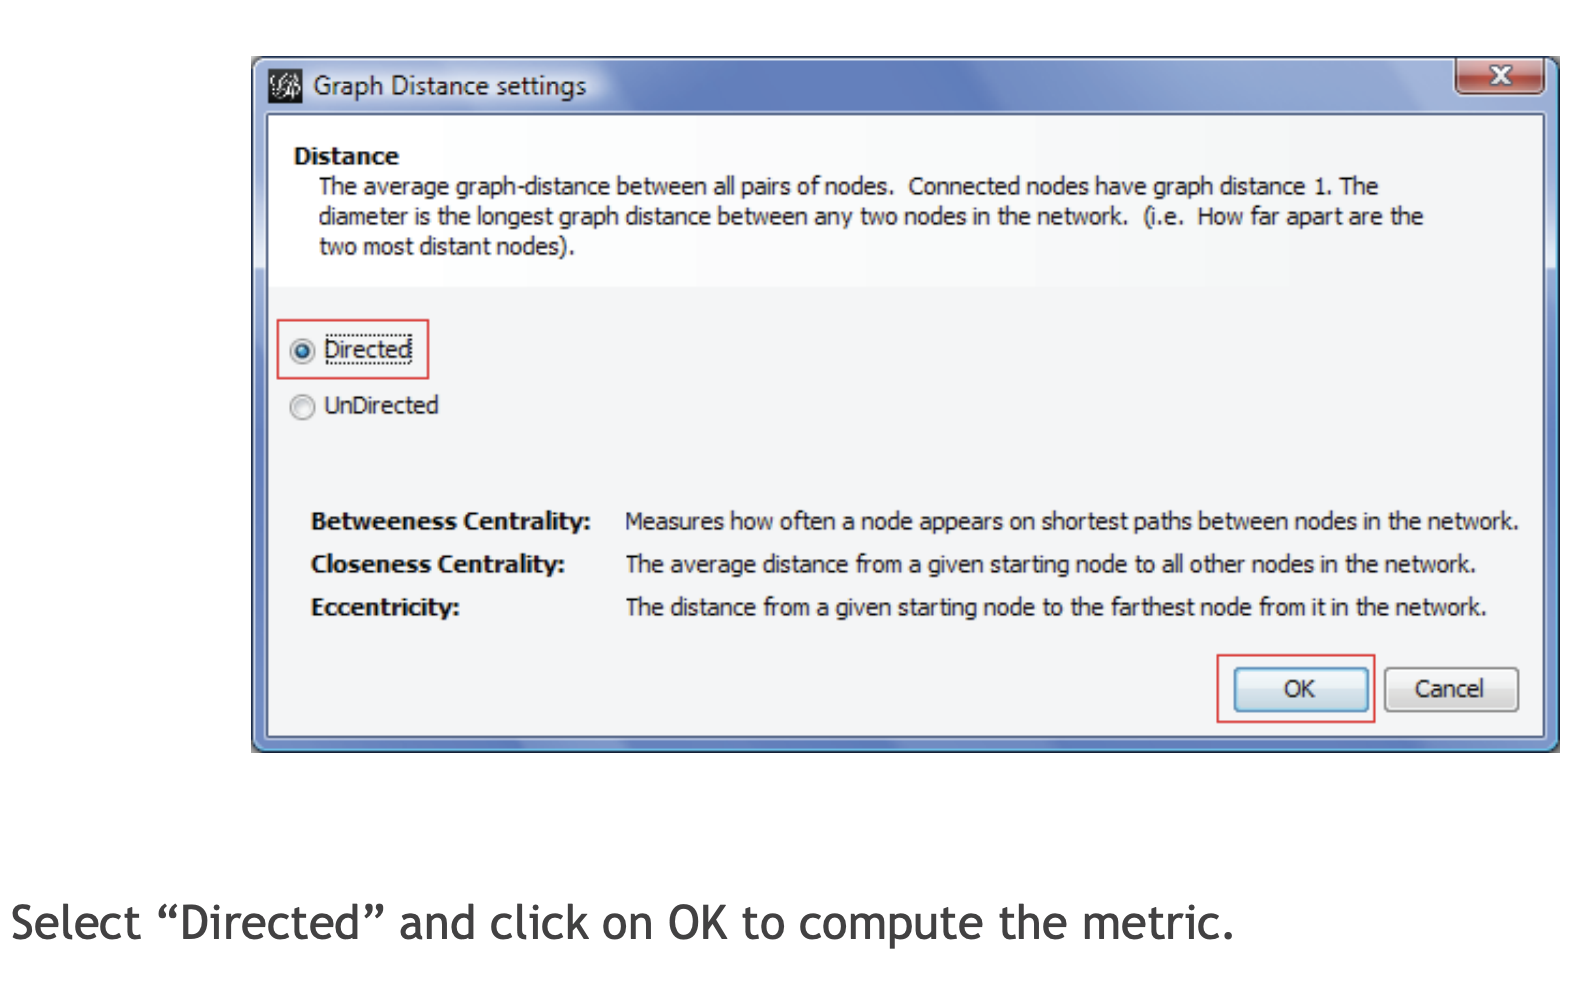
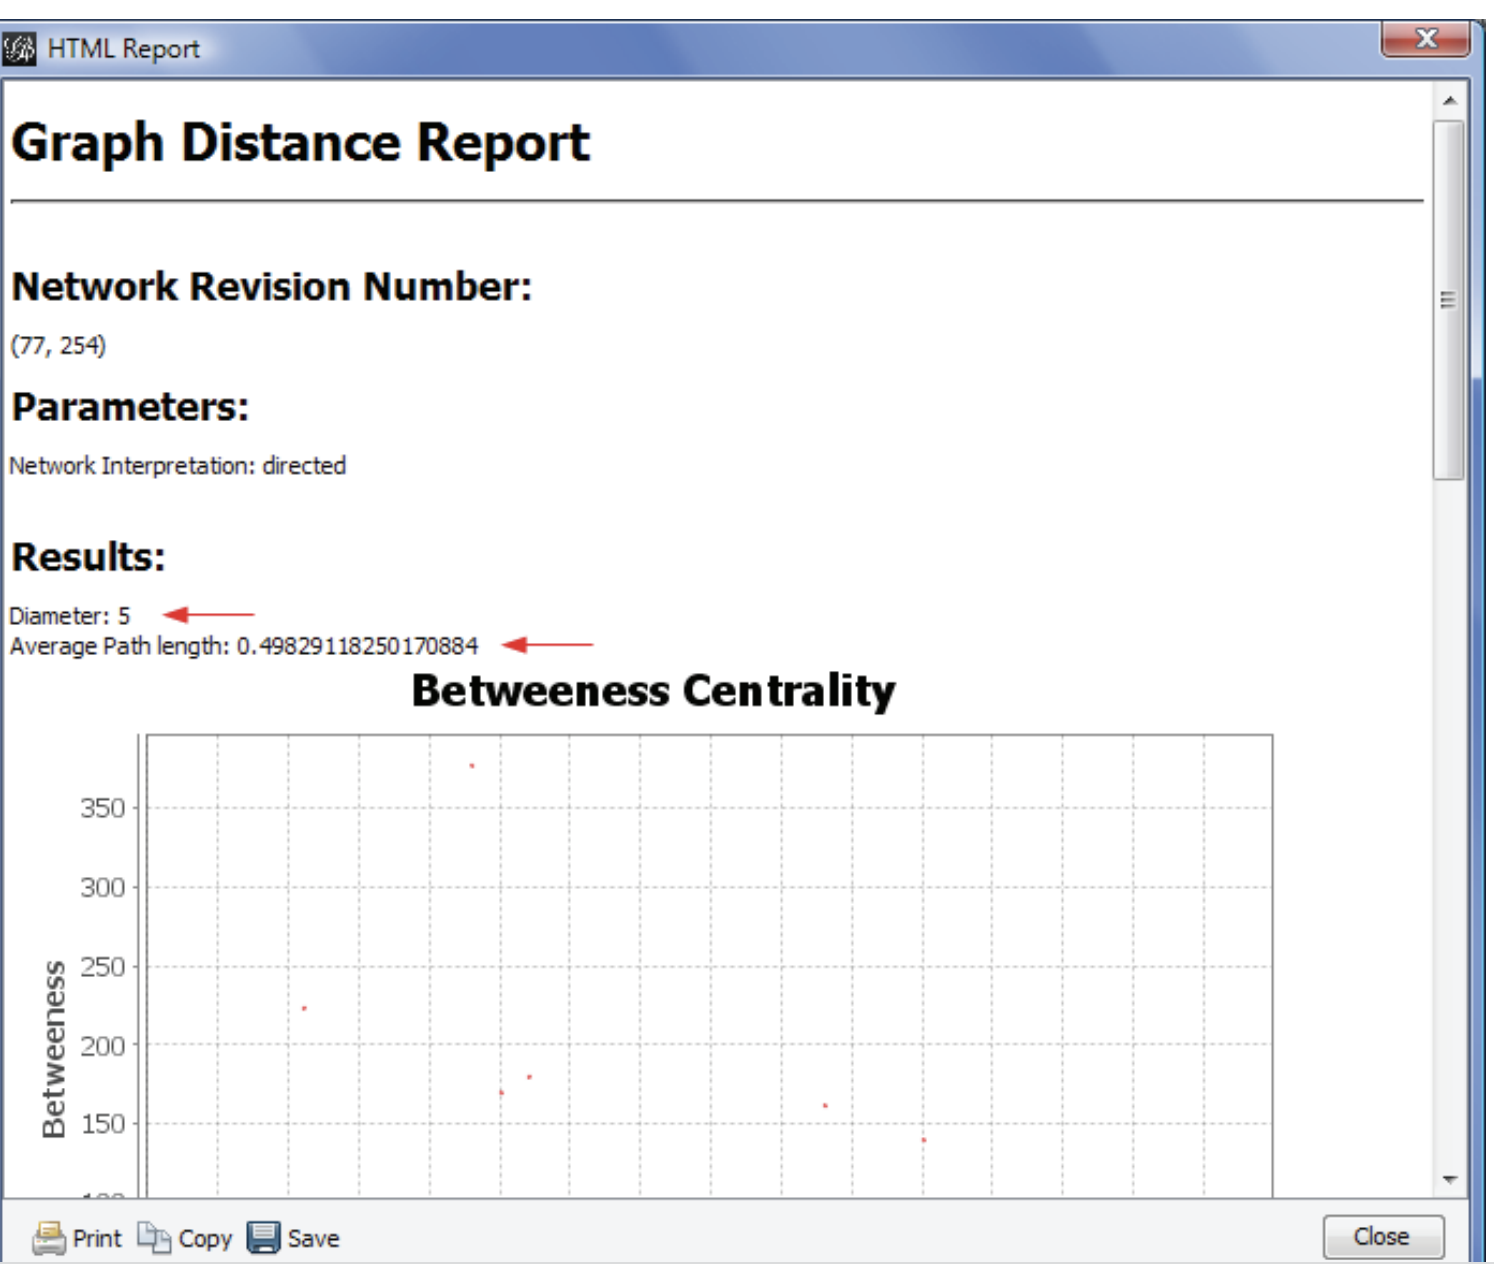
Step 5: Metrics – Calculate the average path length for the network
(Insert 3 charts)
Metrics Setting
Metric Result
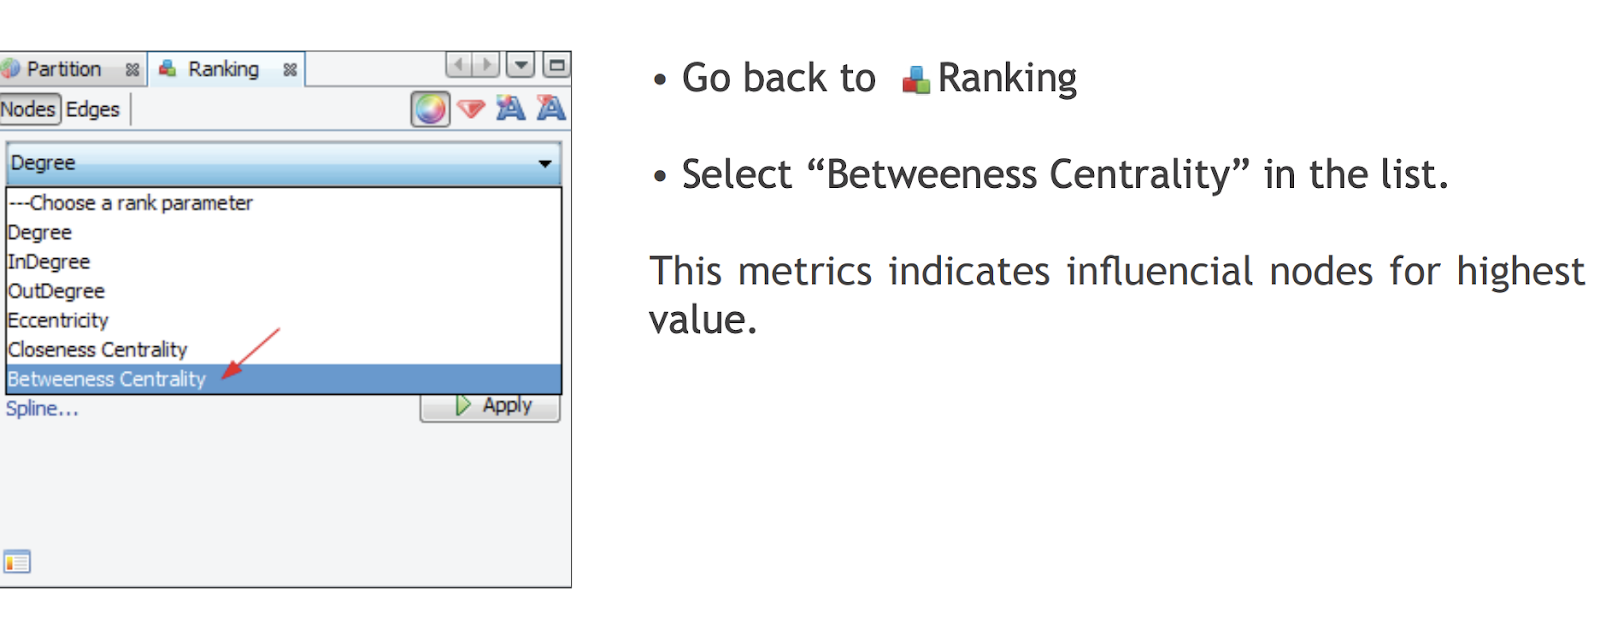
Step 6: Ranking Size - three new values need to be set up
Betweeness Centrality
Closeness Centrality
Eccentricity
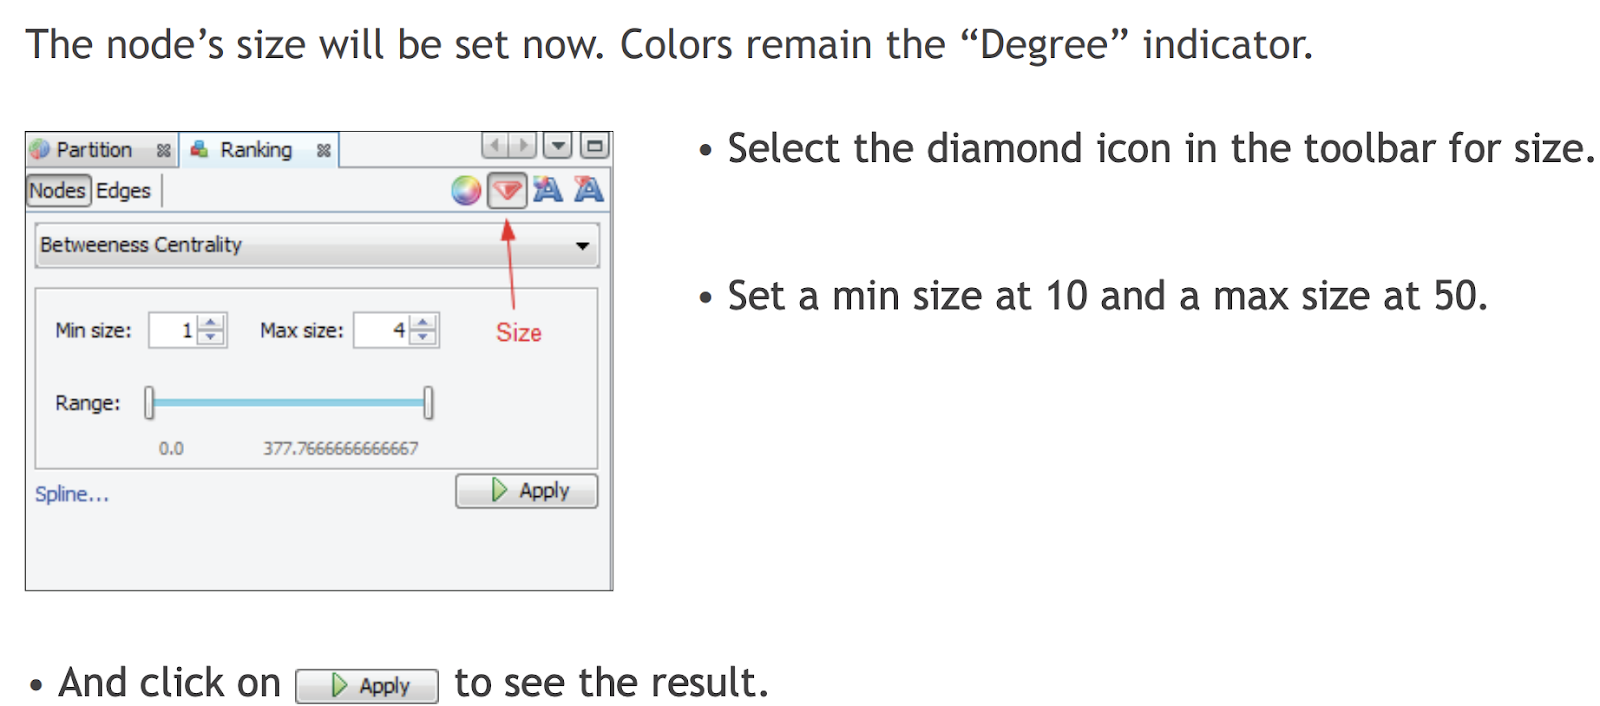
Then, click on the size icon and set up the size.
(Insert 2 charts)
Size
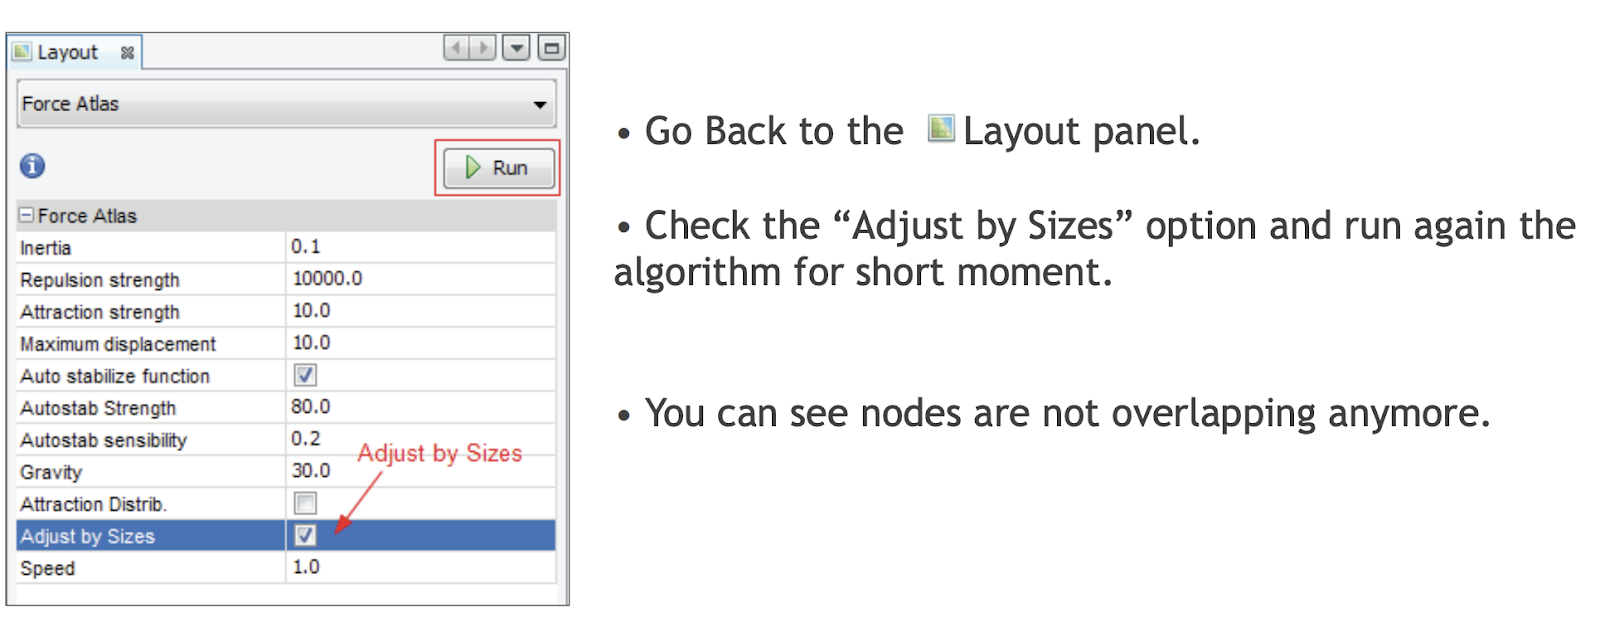
Step 7: Layout Adjustment
(Insert 1 chart)
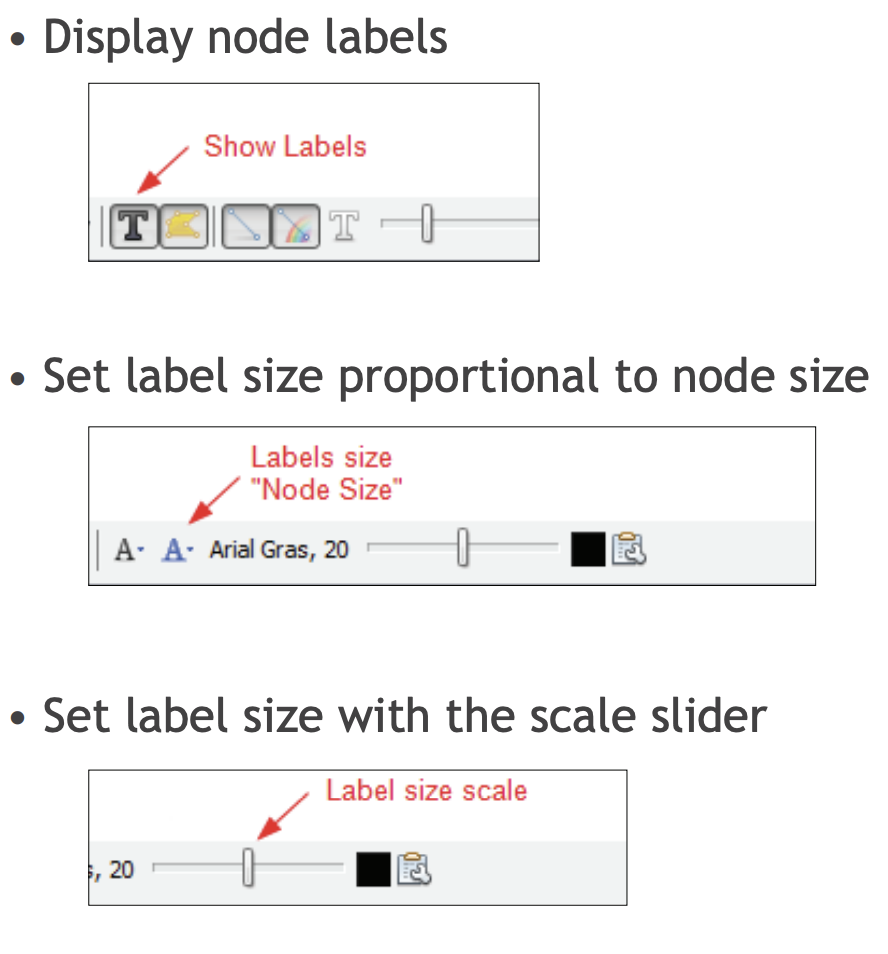
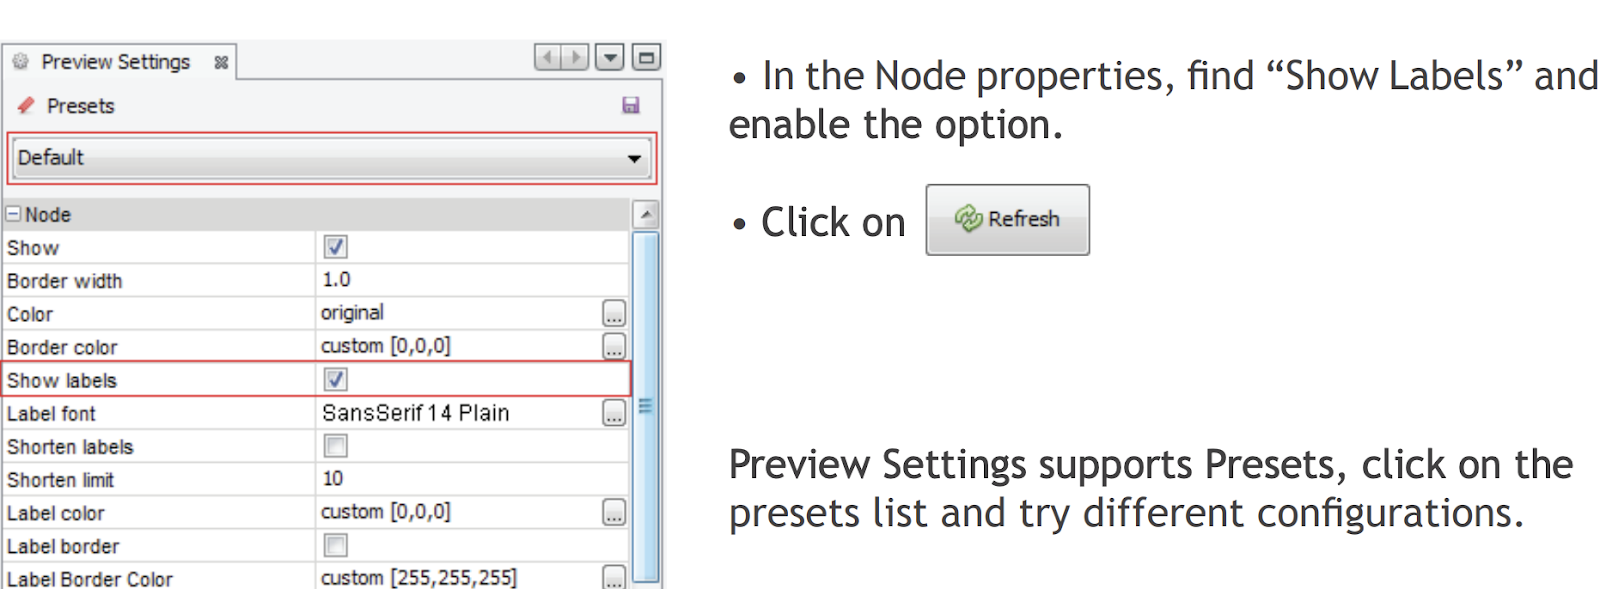
Step 8: Show labels – Display node labels, label size setup and set it with the scale slider
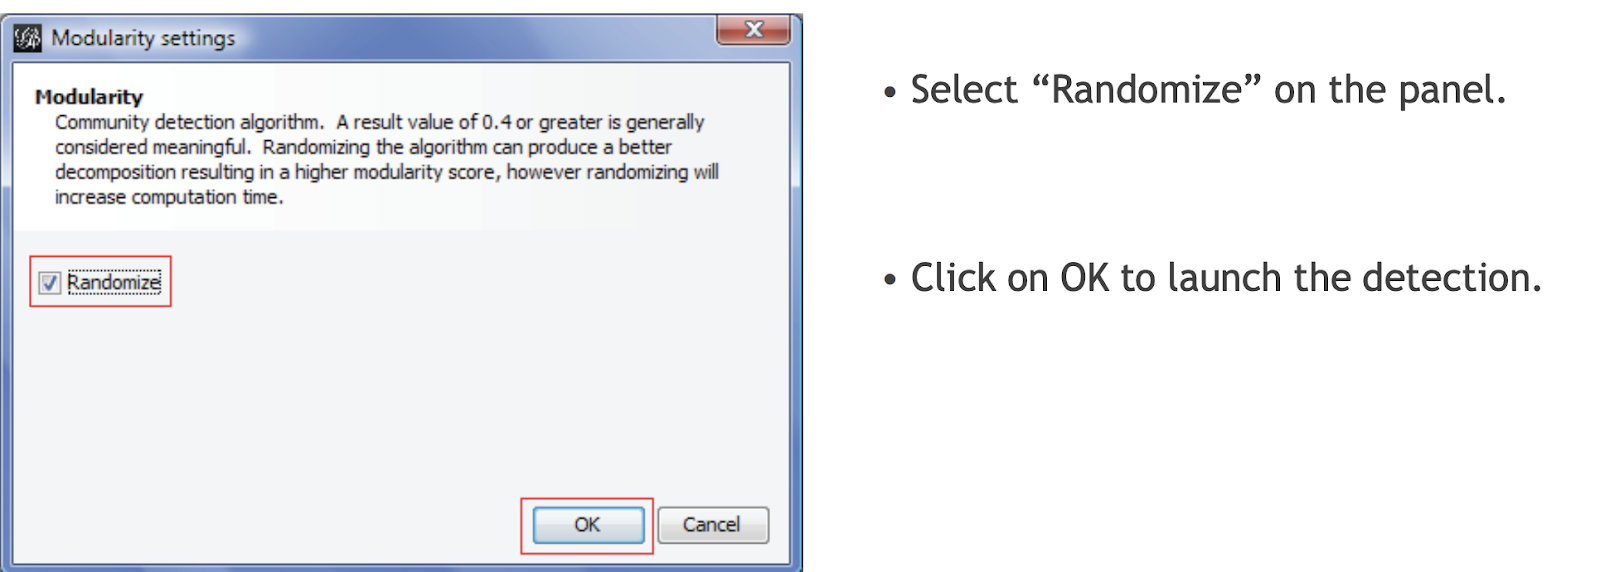
Step 9 to step 11 (Community-detection, partition, filter) are more advanced skills. Please see the tutorial file directly for practice.
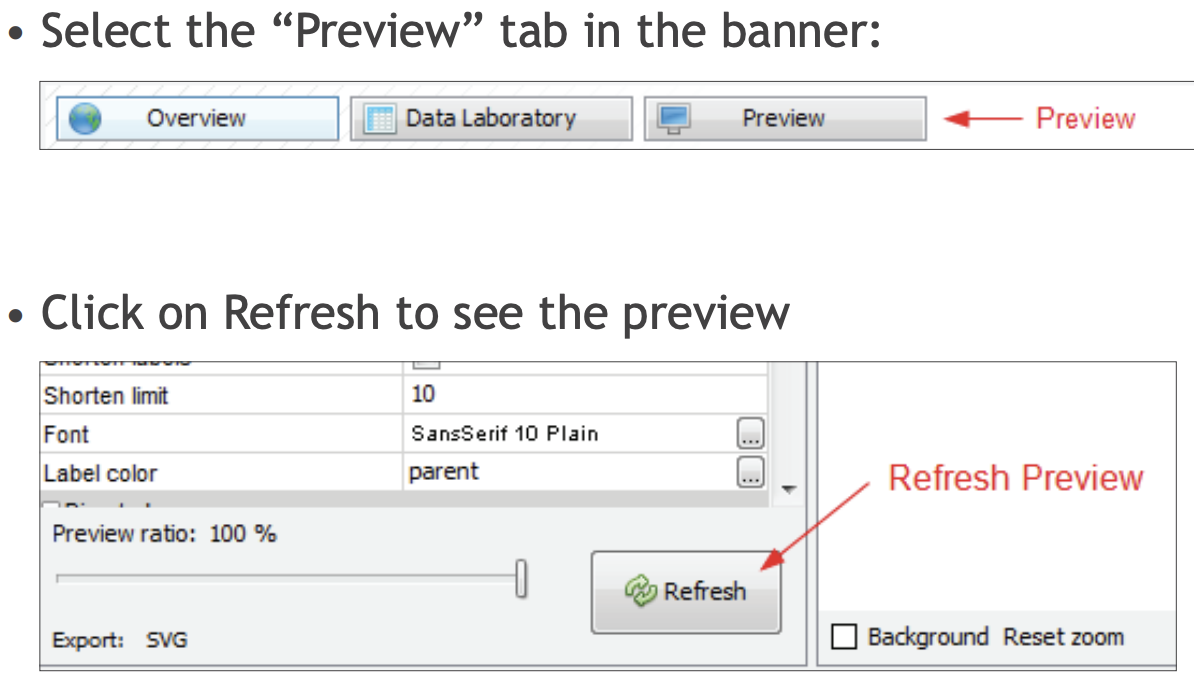
Step 12: Preview – Select the preview tab to preview your analysis graph
(insert 3 charts)
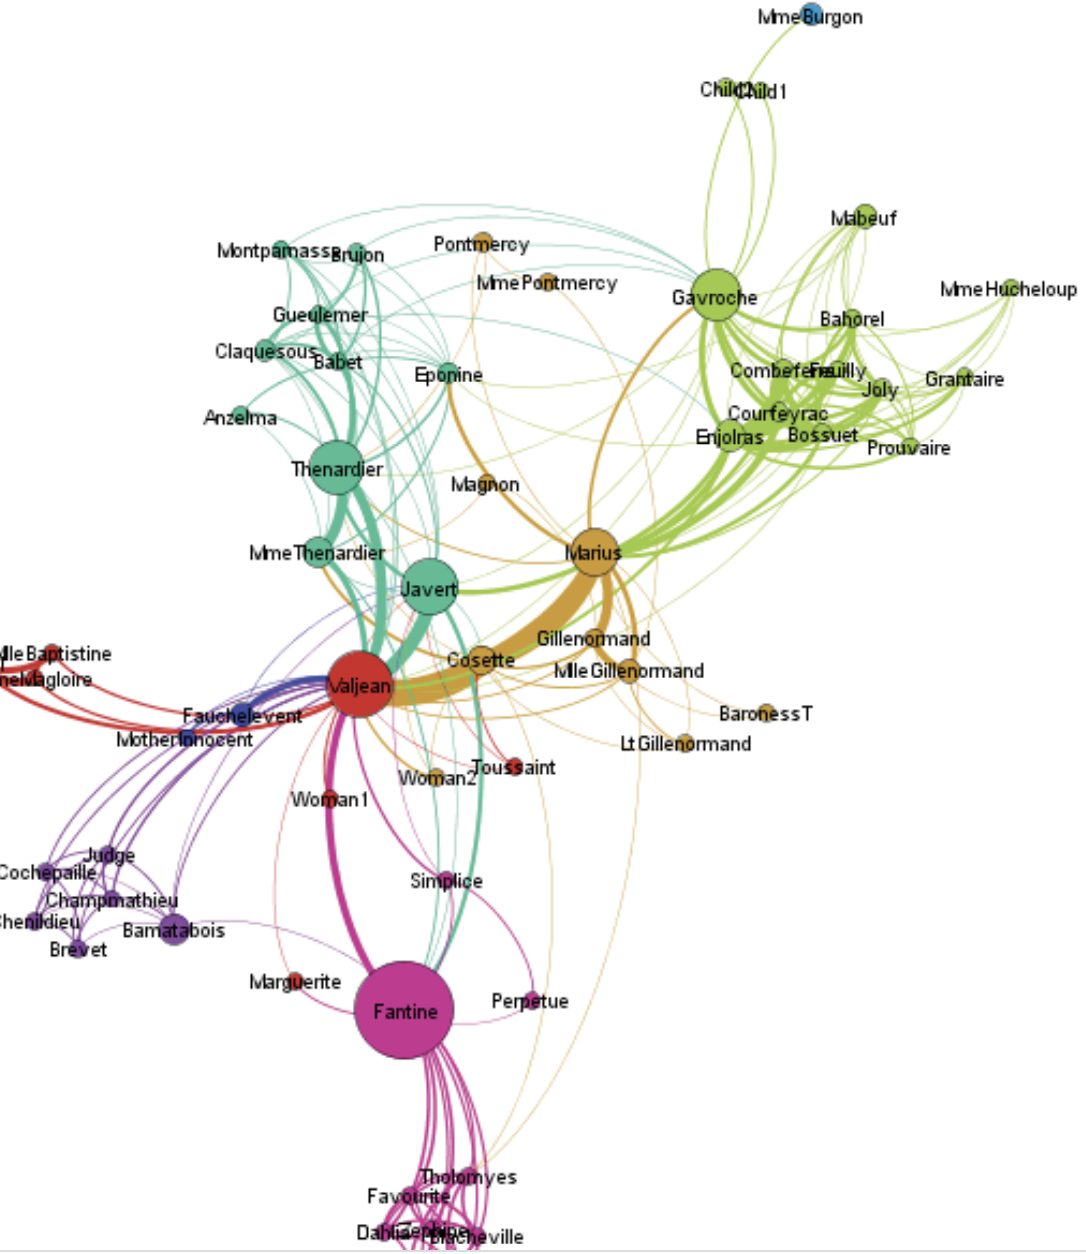
Previewed Graph
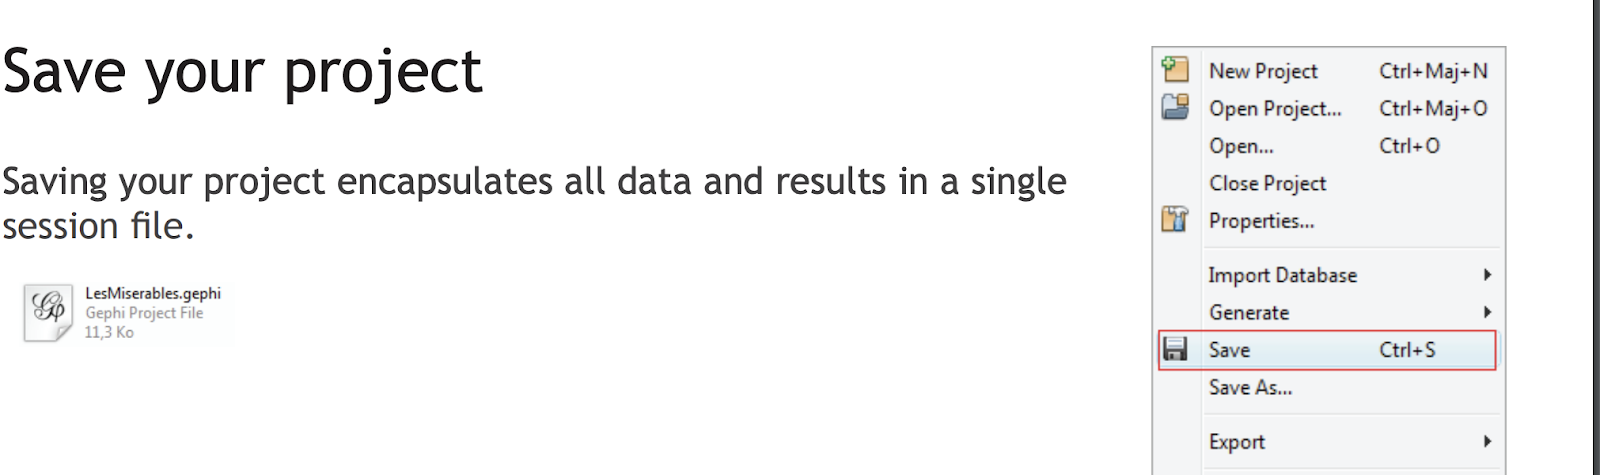
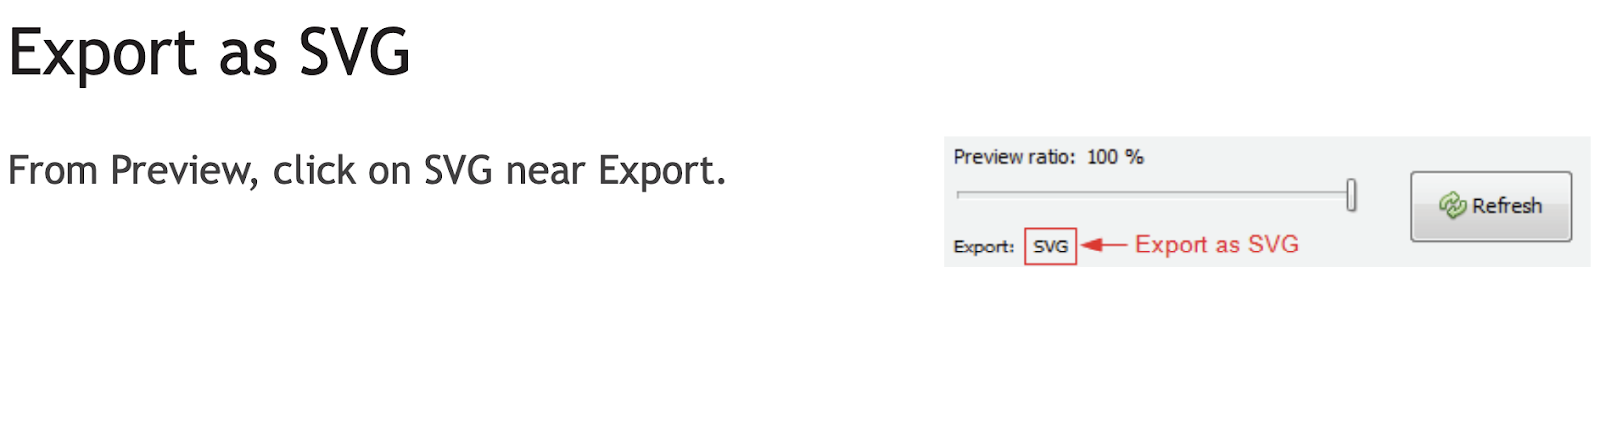
Step 13: Export & Save the project
(insert 2 charts)