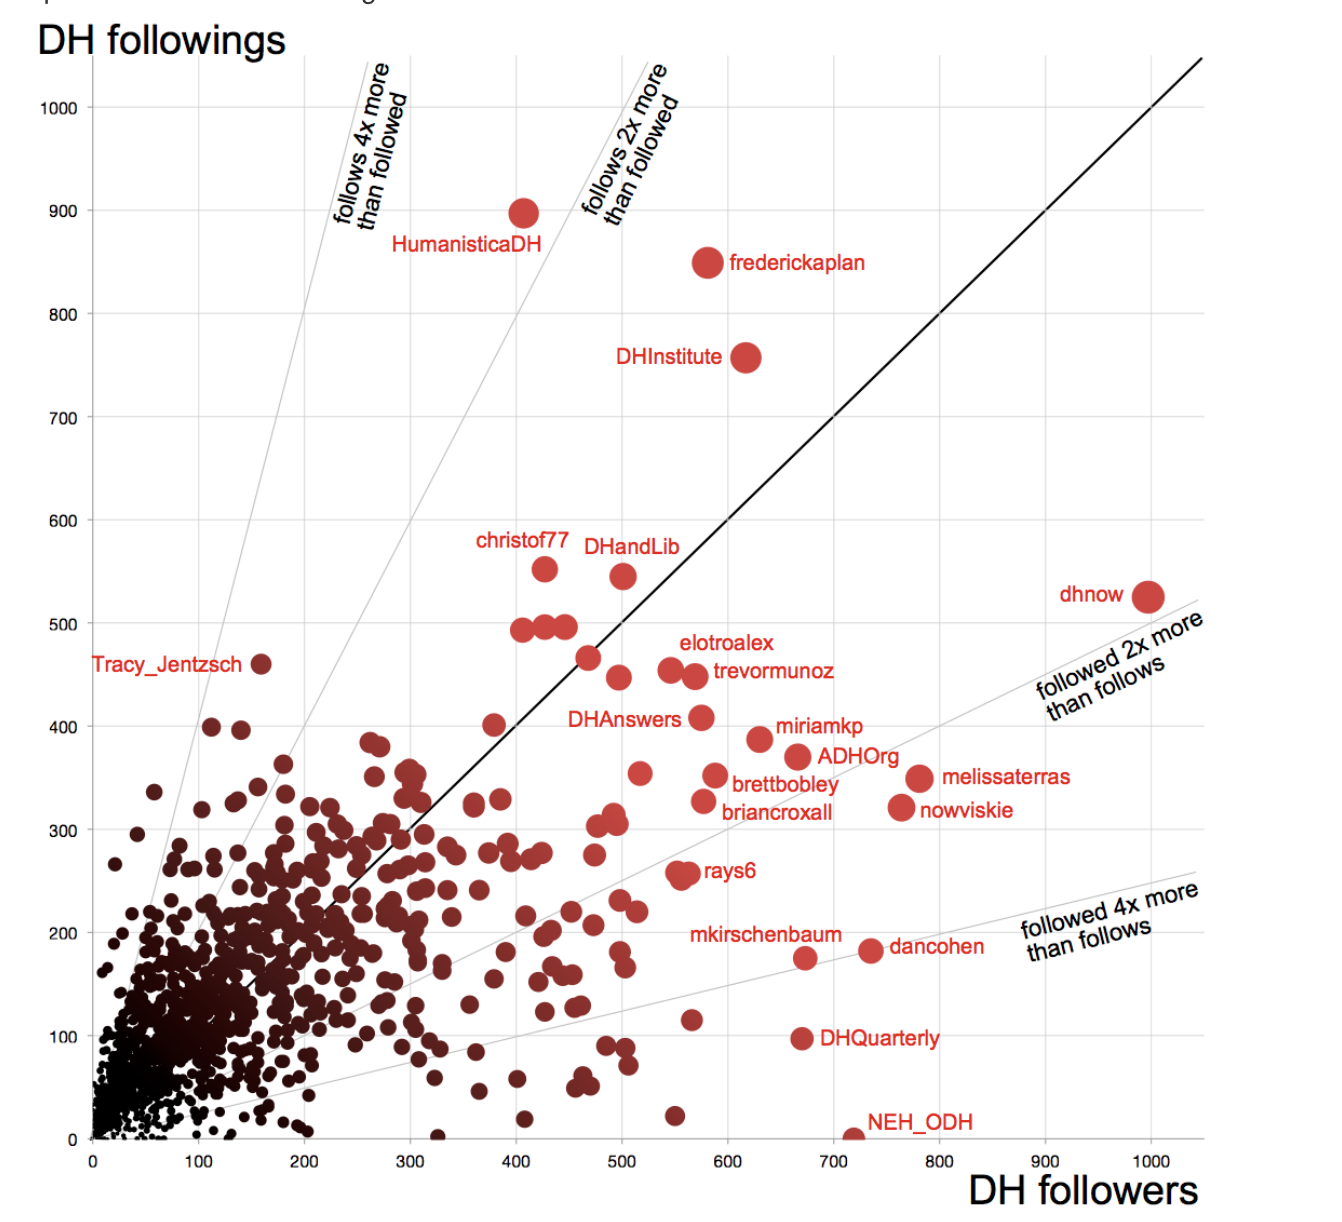
In the twitter network, users are following each other. Above is one example of social networking visual analysis. Here, the lighter colored and bigger size bubbles represents those followed by over 1000 people. The darker and smaller size colored bubbles represents those followed by over 500 people. Those with the color that gets darker and the size gets smaller, the followers get less. In this graph, it shows 1,434 nodes that are connected by 137,061 directed edges. Also, you may see @DHnow is followed by 99 digital humanists and the @Dhnow follows 525 of these followers.
Twitter helps to spread out information and knowledge. This is very true with any digital humanities community where this social media is important. This example visualizes about how who is following who in a particular network.