Here is another example of a research project conducted at University of British Columbia (UBC). The project is called Chinese Canadian Stories – Uncommon Histories from a Common Past. Between 2006-2008, Prof. Peter Ward and Prof. Henry Yu, as well as a team of student researchers at UBC worked for two years with the data for every one of the over 97,000 Chinese in the Chinese Head Tax Register. Through the project, the researchers published a few peer-reviewed research papers.
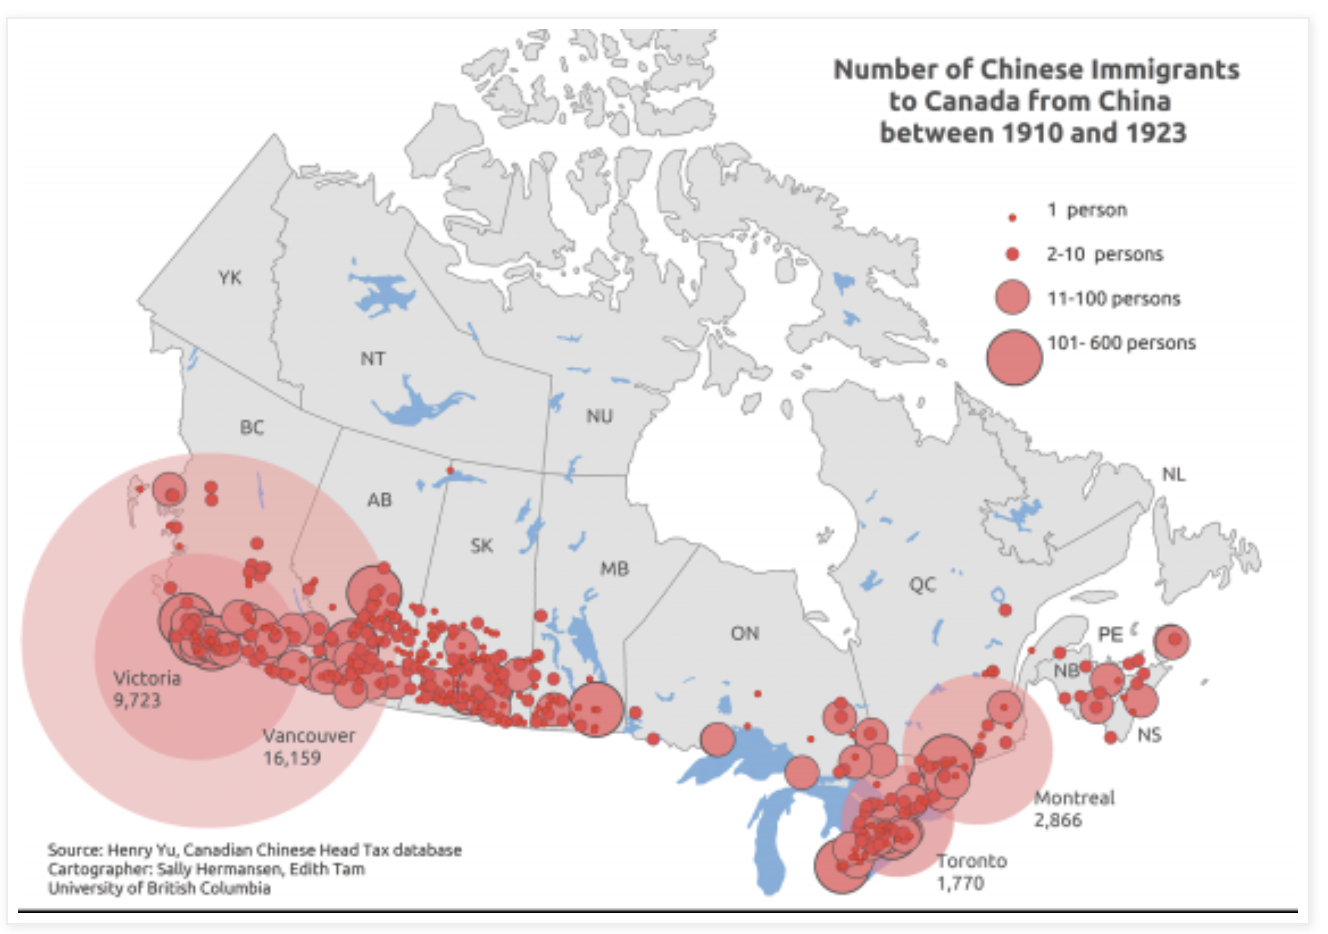
The tool they used in their research reports was Gephi, a visualization network analysis tool. This tool effectively helped them to display or visualize their findings. For example, The chart below shows how many Chinese immigrants landed in Canada between 1910 and 1923 and specifically where they landed in the country.
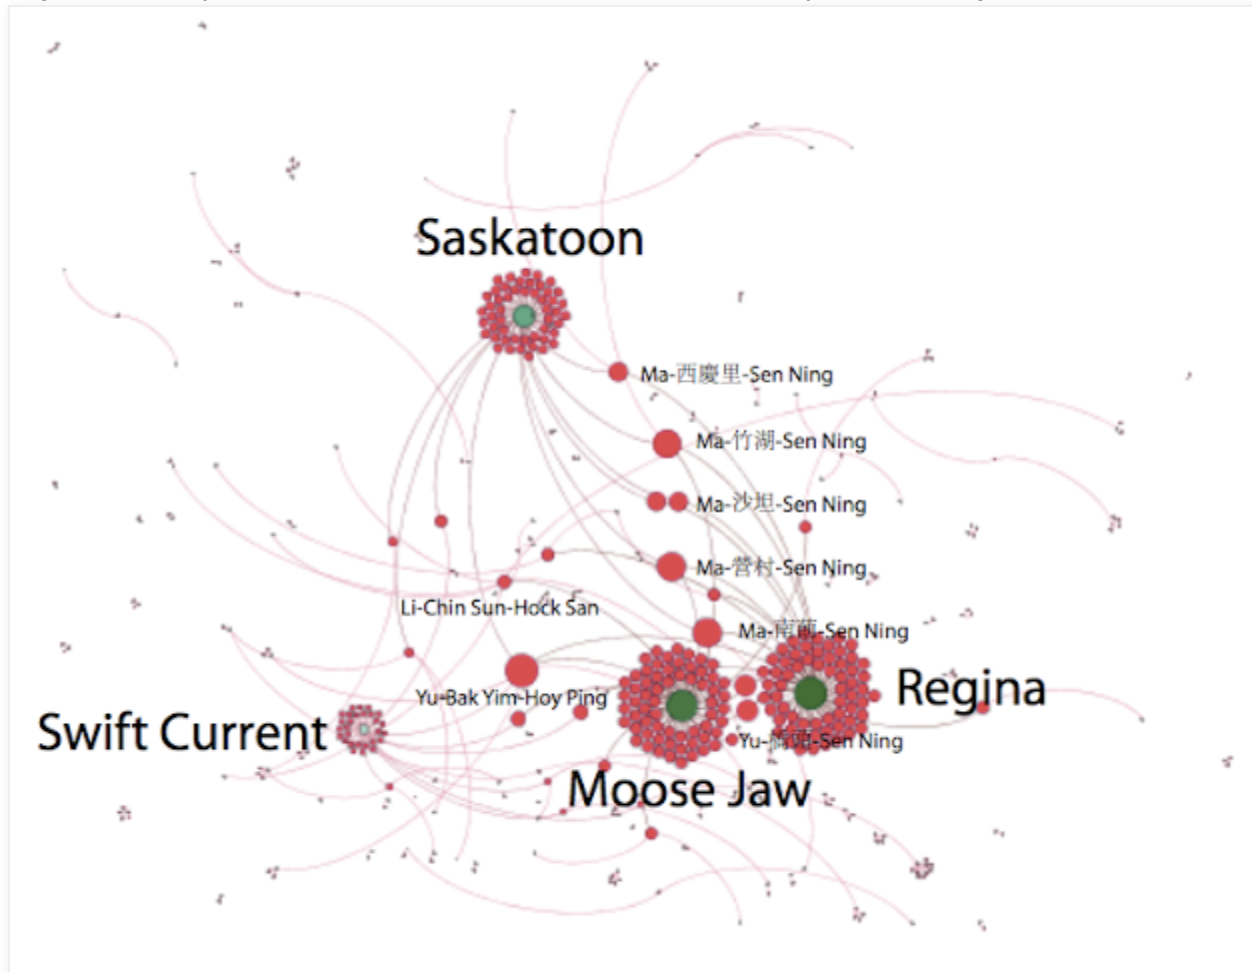
Another example is that Gephi tool helped them to plot locations in a place called Saskatchewan based on longitude, latitude. Then, they filtered the network to only see its connections. Gephi has a feature of showing a high betweenness centrality score to indicate connecting elements within a network. In the Saskatchewan network produced by Gephi below, you can see three major destinations: Saskatoon, Regina, and Moose Jaw, and in which you see a strong Ma clan association through chain migration spreading across Saskatchewan.
For further details of this research project, please see it here.